Webserver benchmarking
The infra has built-in support for benchmarking webserver applications like
Nginx. In such setups, the infra runs an instrumented version of the server
application, and then runs a (uninstrumented) client program to benchmark the
performance of the server (typically, wrk).
The setup to run webserver benchmarks, however, is more complicated than it is for targets like SPEC. In particular, two machines are required (one for the server and one for the client), with a fast network connection between them (e.g., 40 Gbit). The key goal of webserver benchmarks is to reach CPU saturation already on the baseline. If saturation is not reached, any measured overhead is practically meaningless (since it’s hidden by the spare CPU cycles). While far from ideal, it is preferable to use a loopback setup (running client and server on a single machine, dividing the cores evenly) rather than use a setup where no saturation is reached (e.g., 1 Gbit connection).
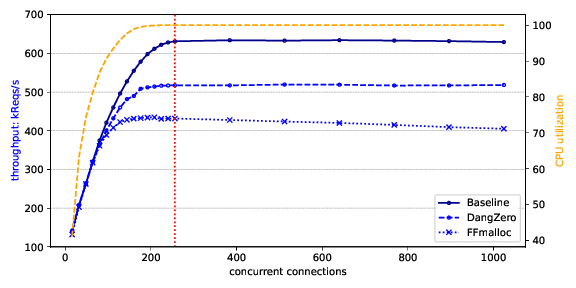
For benchmarks, the saturation/peak performance point should be determined for the baseline, and that point is then used to measure the overhead (both in throughput decrease and latency increase). To do so, we typically construct a graph as shown below. This increases the pressure of the client by increasing its number of connection (X-axis), and measures both the throughput (in requests/second) and CPU utilization. In this graph, we see a peak at 256 connections, at which point the throughput overhead for “DangZero” is 18% (623 kReqs/s -> 516 kReqs/s). Not shown in this graph is the latency: that should be measured at the same saturation point, and reported separately in a table (as percentiles, e.g., 99th percentile).
The infra has several options for running this setup automatically on separate
machines. The recommended way is to use the SSH method (using
--parallel=ssh). This guide follows this method. Note that this setup can
use localhost as an SSH target, meaning one (or even both, for loopback
experiments) of the nodes can be the same as the one running the infra.
This whole process currently requires a lot of arguments to setup.py. Below,
we show a script that provides good defaults for most arguments.
#!/bin/bash
set -euo pipefail

servers="nginx"
instances="baseline dangzero"

# Sweep over connection count, decreasing in density as we go higher
connections="`seq 16 16 256` `seq 256 128 1024` `seq 1024 256 1536`"

# SSH names - used as `ssh <host>`, so can be a host config the SSH config
sshclient=father
sshserver=son
# Local hosts - how to connect to each node via TCP
hostclient=localhost
hostserver=192.168.0.10
# Benchmark host (100G NIC) - how the client connects to server
serverip=10.0.0.10
serverport=20000

iterations=3  # Repeat experiments a few times
filesize=64  # Data per request, in bytes
duration=30  # Time per experiment in seconds
wait_time=1  # Time to wait between experiments


client_threads=`nproc`  # Threads - should always be max, i.e., nproc

server_workers=`nproc`  # Worker processes on server - should be max
server_worker_connections=1024  # Max connections per worker - do not change

# Statistics to collect of server
stats="cpu rss"  # Space-separated list of {cpu, cpu-proc, rss, vms}
stats_interval=1  # Time between measurements, in seconds


for server in $servers; do
    python3 ./setup.py run $server $instances \
        -t bench \
        --parallel=ssh \
        --ssh-nodes $sshclient $sshserver \
        --remote-client-host $hostclient \
        --remote-server-host $hostserver \
        --server-ip $serverip \
        --port $serverport \
        --duration $duration \
        --threads $client_threads \
        --iterations $iterations \
        --workers $server_workers \
        --worker-connections $server_worker_connections \
        --filesize $filesize \
        --collect-stats $stats \
        --collect-stats-interval $stats_interval \
        --connections $connections \
        --restart-server-between-runs
done
Options you may want to have a look at:
connectionsshould cover a range so that you can observe the growth to saturation, and after the peak point a drop-off in throughput (with lower number more densely sampled).iterationsrepeats each experiment N times to reduce noise. A value of 3 or 5 is recommended, unless high standard deviations are observed.filesizeis the size of the file that the benchmark retrieves. Higher values put more pressure on the network link without increasing CPU pressure, and thus lower values are recommended for CPU saturation.durationis the length of each experiment in seconds. Normally 30 second runs are fine, but if you are benchmarking something with increased memory pressure over time you may need to run longer benchmarks (e.g., 10 minutes).
Finally, there are the SSH, host and server IP settings which require some explanation:
- The
sshclientandsshserverdescribe how the setup.py script can reach the machines running the client (wrk) and server (the webserver). These are SSH hostnames, and can be an IP or a hostname from the.ssh/configfile.- The setup.py script spawns a python script (
remoterunner.py) on both the client and server machines via SSH. After that it connects to these scripts via TCP directly, andhostclientandhostserverdescribe the IP addresses of how to connect to these. If you used IP addresses for the SSH client/server fields, these fields probably hold the same values.- Finally, once the benchmark starts the client machine will run run
wrkagainst the webserver on the host. The IP address that the client machine uses to connect to the server machine is configured viaserverip. This might be the same IP ashostserver, but it might also be different: for the SSH and host fields these connections can go over any link (localhost, built-in 1 Gbit NIC, QEMU virtual NIC, etc). For theserveripfield, however, the IP associated to the fast NIC (e.g., 40 or 100 Gbit) should be used to ensure CPU saturation.
The setup.py script can run on one of the two machines (client or server): in
the example above, the setup.py script runs on the client machine (the one that
will also run wrk). It furthermore assumes the father (client) and
son (server) hosts are in .ssh/config and can be used without a
passphrase (e.g., via an SSH agent). The machines are in a LAN in the
192.168.0.0/24 range, whereas the 100 Gbit NICs use the 10.0.0.0/24
range. This is configured manually via:
father $ ifconfig ens4 10.0.0.20 up
son $ ifconfig ens4 10.0.0.10 up
Finally, the infra can collect statistics during the execution of each test on the server. One of these statistics is the CPU usage, which is used to ensure saturation was reached. These statistics can be sampled every N seconds, and the following are supported:
cpu: total CPU load of the system.cpu-proc: CPU load per process.rss: RSS (resident set size) of the server. I.e., physical memory usage.vms: VMS (virtual memory size) of the server.
In a VM
Some mitigations, especially those featuring kernel or hypervisor modifications, require running the target webserver in a VM. Running benchmarks in a VM is fine, but care has to be taken to ensure a proper setup.
As a basis for any reasonable benchmark, the VM should be hardware accelerated (e.g., using KVM with Intel VMX or AMD-V), with sufficient memory and CPU cores assigned. Additionally, a VM may optionally be backed by hugepages.
As with the experiments on bare-metal (as described above), the VM also needs
direct access to a fast NIC. Using something like virtio is, in our
experience, not fast enough. Instead, a fast NIC should be directly
assigned to the VM. This can be achieved through either SR-IOV (for devices
that support virtualization and assigning part of it to a VM), or full PCI
passthrough of the device. For this guide, we assume the latter as it is more
generically applicable.
Enabling IOMMU
Passing the NIC to the guest requires an IOMMU to be enabled in the system. For
this, ensure the IOMMU (VT-d or AMD-Vi) is enabled in the BIOS settings. Add
intel_iommu=on or amd_iommu=on to the kernel boot parameters (e.g., by
modifying GRUB_CMDLINE_LINUX_DEFAULT in /etc/default/grub and then
running update-grub).
After this, running dmesg after boot should show messages related to
IOMMU/DMAR being enabled.
Next we need to check the IOMMU groups. It is only possible to pass a whole VM
group to a VM, not only part of its devices. First ensure
/sys/kernel/iommu_groups/ exists and has a few directories. Then, run the
following command in your terminal:
for g in $(find /sys/kernel/iommu_groups/* -maxdepth 0 -type d | sort -V); do
    echo "IOMMU Group ${g##*/}:"
    for d in $g/devices/*; do
        echo -e "\t$(lspci -nns ${d##*/})"
    done;
done;
If the NIC does not have its own IOMMU group, try plugging it into a different slot on the main board. Typically, the “primary” or first slot of a mainboard has its own IOMMU group at least.
VFIO
To assign the device to the VM, we need to unbind its original driver (e.g.,
mlx5_core for Mellanox cards), and bind it to the vfio-pci driver.
First, find the BDF (bus:device.function, basically the physical slot of the PCI card) and vendor:device pair of the card:
$ lspci -nn
...
b3:00.0 Ethernet controller [0200]: Mellanox Technologies MT27700 Family [ConnectX-4] [15b3:1013]
...
We can see here that its BDF is b3:00.0 (in full form, 0000:b3:00.0, and
the vendor:device pair is 15b3:1013.
Now, check which driver is in use for this device:
$ lspci -d 15b3:1013 -k
b3:00.0 Ethernet controller: Mellanox Technologies MT27700 Family [ConnectX-4]
    Subsystem: Mellanox Technologies MT27700 Family [ConnectX-4]
    Kernel driver in use: mlx5_core
    Kernel modules: mlx5_core
Which is the mlx5_core Mellanox driver. We need to unbind this driver from
the card:
echo 0000:b3:00.0 | sudo tee /sys/bus/pci/drivers/mlx5_core/unbind
Then, allow vfio-pci to bind to this device:
echo 15b3 1013 | sudo tee /sys/bus/pci/drivers/vfio-pci/new_id
When running lspci -d 15b3:1013 -k again, it should report Kernel driver
in use: vfio-pci. If this is not already the case, execute the following
command to force the binding:
echo 0000:b3:00.0 | sudo tee /sys/bus/pci/drivers/vfio-pci/bind
QEMU
To pass the device to the VM, we add the -device vfio-pci,host=<BDF> option
to qemu:
sudo qemu-system-x86_64 -m 8G -enable-kvm -cpu host -device vfio-pci,host=b3:00.0 -nographic -serial mon:stdio debian.img
We run this with sudo, otherwise we get errors about mapping memory and
such.
Inside the VM, we should see the card show up like it did on the host before:
vm $ lspci -d 15b3:1013 -k
00:04.0 Ethernet controller: Mellanox Technologies MT27700 Family [ConnectX-4]
Subsystem: Mellanox Technologies MT27700 Family [ConnectX-4]
Kernel driver in use: mlx5_core
Kernel modules: mlx5_core
Note it now has the same vendor:device identifier, but a different BDF
(00:04.0). We can now check which network interface is associated with this
NIC:
vm $ ls /sys/bus/pci/devices/0000\:00\:04.0/net/
ens2
Which we can then configure as normal:
vm $ ifconfig ens2 10.0.0.10 up
Hugepage backing for VM
Forcing hugepage backing for the VM is not required: in most cases we have noticed no significant effect for webserver applications. However, it might be required if the instrumentation of the target increases memory or TLB pressure a lot. In this case, you might notice significant performance differences between runs, depending on when the THP (transparent huge pages) on the host kick in.
You can follow the guide from RedHat: https://access.redhat.com/solutions/36741
When using QEMU directly instead of libvirt, add the following command line options (instead of the modifications to guest.xml):
-mem-prealloc
-mem-path /hugepages/libvirt/qemu